Quickstart example
Georg Rüppel
2024-12-04
Source:vignettes/movetrack_example.Rmd
movetrack_example.RmdThis is a quickstart guide to model and visualize animal movements
from radio-telemetry data using the movetrack package.
library(movetrack)
library(ggplot2)
theme_set(theme_bw(base_size = 15))

# Load example data
data(motusData)
Estimate locations
The first step involves estimating animal locations based on antenna
bearings and signal strength at two-minute intervals using the
locate function.
loc <- locate(motusData, dTime = 2)## Removed 10 detections containing missing values.Model flight paths
Next, we model the animal’s flight paths using Markov Chain Monte
Carlo (MCMC) with four parallel chains utilising the track
function and return a summary of the results.
fit <- track(loc, parallel_chains = 4, refresh = 1e3)## Running MCMC with 4 parallel chains...
##
## Chain 1 Iteration: 1 / 2000 [ 0%] (Warmup)## Chain 2 Iteration: 1 / 2000 [ 0%] (Warmup)## Chain 3 Iteration: 1 / 2000 [ 0%] (Warmup)## Chain 4 Iteration: 1 / 2000 [ 0%] (Warmup)## Chain 3 Iteration: 1000 / 2000 [ 50%] (Warmup)
## Chain 3 Iteration: 1001 / 2000 [ 50%] (Sampling)
## Chain 1 Iteration: 1000 / 2000 [ 50%] (Warmup)
## Chain 1 Iteration: 1001 / 2000 [ 50%] (Sampling)
## Chain 4 Iteration: 1000 / 2000 [ 50%] (Warmup)
## Chain 4 Iteration: 1001 / 2000 [ 50%] (Sampling)
## Chain 3 Iteration: 2000 / 2000 [100%] (Sampling)
## Chain 3 finished in 128.7 seconds.
## Chain 2 Iteration: 1000 / 2000 [ 50%] (Warmup)
## Chain 2 Iteration: 1001 / 2000 [ 50%] (Sampling)
## Chain 1 Iteration: 2000 / 2000 [100%] (Sampling)
## Chain 1 finished in 150.3 seconds.
## Chain 2 Iteration: 2000 / 2000 [100%] (Sampling)
## Chain 2 finished in 171.0 seconds.
## Chain 4 Iteration: 2000 / 2000 [100%] (Sampling)
## Chain 4 finished in 185.8 seconds.
##
## All 4 chains finished successfully.
## Mean chain execution time: 158.9 seconds.
## Total execution time: 185.9 seconds.
fitClick to expand
##        ID                time  lon  lat distance  speed
## 1   49237 2023-08-20 20:16:00 8.80 54.8       NA     NA
## 2   49237 2023-08-20 20:18:00 8.80 54.8     1110   9.25
## 3   49237 2023-08-20 20:20:00 8.79 54.8     1358  11.32
## 4   49237 2023-08-20 20:22:00 8.79 54.8     1476  12.30
## 5   49237 2023-08-20 20:24:00 8.78 54.8     1571  13.09
## 6   49237 2023-08-20 20:26:00 8.77 54.8     1681  14.01
## 7   49237 2023-08-20 20:28:00 8.76 54.8     1876  15.63
## 8   49237 2023-08-20 20:30:00 8.75 54.8     2021  16.84
## 9   49237 2023-08-20 20:32:00 8.74 54.7     1920  16.00
## 10  49237 2023-08-20 20:34:00 8.74 54.7     1804  15.04
## 11  49237 2023-08-20 20:36:00 8.74 54.7     1733  14.44
## 12  49237 2023-08-20 20:38:00 8.75 54.7     1680  14.00
## 13  49237 2023-08-20 20:40:00 8.76 54.7     1567  13.06
## 14  49237 2023-08-20 20:42:00 8.77 54.7     1425  11.87
## 15  49237 2023-08-20 20:44:00 8.78 54.7     1364  11.36
## 16  49237 2023-08-20 20:46:00 8.78 54.7     1375  11.46
## 17  49237 2023-08-20 20:48:00 8.79 54.7     1531  12.75
## 18  49237 2023-08-20 20:50:00 8.80 54.6     1847  15.39
## 19  49237 2023-08-20 20:52:00 8.80 54.6     2191  18.26
## 20  49237 2023-08-20 20:54:00 8.81 54.6     2333  19.44
## 21  49237 2023-08-20 20:56:00 8.81 54.6     2294  19.11
## 22  49237 2023-08-20 20:58:00 8.82 54.6     2444  20.37
## 23  49237 2023-08-20 21:00:00 8.82 54.5     2738  22.82
## 24  49237 2023-08-20 21:08:00 8.83 54.5     2919   6.08
## 25  49237 2023-08-20 21:10:00 8.82 54.5     2701  22.51
## 26  49237 2023-08-20 21:12:00 8.82 54.5     2228  18.57
## 27  49237 2023-08-20 21:14:00 8.81 54.5     1910  15.91
## 28  49237 2023-08-20 21:16:00 8.79 54.4     1770  14.75
## 29  49237 2023-08-20 21:18:00 8.78 54.4     1698  14.15
## 30  49237 2023-08-20 21:20:00 8.77 54.4     1698  14.15
## 31  49237 2023-08-20 21:22:00 8.76 54.4     1811  15.09
## 32  49237 2023-08-20 21:24:00 8.75 54.4     1958  16.32
## 33  49237 2023-08-20 21:26:00 8.75 54.4     1844  15.37
## 34  49237 2023-08-20 21:28:00 8.75 54.4     1708  14.23
## 35  49237 2023-08-20 21:30:00 8.76 54.4     1650  13.75
## 36  49237 2023-08-20 21:32:00 8.76 54.3     1702  14.18
## 37  49237 2023-08-20 21:34:00 8.76 54.3     1717  14.31
## 38  49237 2023-08-20 21:36:00 8.77 54.3     1603  13.36
## 39  49237 2023-08-20 21:38:00 8.77 54.3     1429  11.91
## 40  49237 2023-08-20 21:40:00 8.77 54.3     1404  11.70
## 41  49237 2023-08-20 21:42:00 8.77 54.3     1539  12.83
## 42  49237 2023-08-20 21:44:00 8.77 54.3     1804  15.03
## 43  49237 2023-08-20 21:46:00 8.77 54.3     2142  17.85
## 44  49237 2023-08-20 21:48:00 8.77 54.2     2258  18.82
## 45  49237 2023-08-20 21:50:00 8.77 54.2     2493  20.78
## 46  49237 2023-08-20 21:52:00 8.76 54.2     2812  23.43
## 47  49237 2023-08-20 22:10:00 8.76 54.2     2740   2.54
## 48  49237 2023-08-20 22:12:00 8.75 54.1     2443  20.36
## 49  49237 2023-08-20 22:14:00 8.74 54.1     2054  17.11
## 50  49237 2023-08-20 22:16:00 8.73 54.1     2017  16.81
## 51  49237 2023-08-20 22:24:00 8.72 54.1     2303   4.80
## 52  49237 2023-08-20 22:26:00 8.71 54.1     2695  22.46
## 53  49237 2023-08-20 22:28:00 8.70 54.0     3364  28.03
## 54  49237 2023-08-20 22:30:00 8.69 54.0     4277  35.65
## 55  49237 2023-08-20 22:34:00 8.68 54.0     5311  22.13
## 56  49237 2023-08-20 23:00:00 8.65 53.9     5980   3.83
## 57  49237 2023-08-20 23:02:00 8.63 53.9     6718  55.98
## 58  49237 2023-08-20 23:04:00 8.59 53.8     7558  62.98
## 59  49237 2023-08-21 00:16:00 8.55 53.7     8155   1.89
## 60  49237 2023-08-21 00:18:00 8.50 53.7     8341  69.51
## 61  49237 2023-08-21 00:20:00 8.45 53.6     8066  67.22
## 62  49237 2023-08-21 00:22:00 8.40 53.5     7826  65.22
## 63  49237 2023-08-21 00:24:00 8.34 53.5     7748  64.57
## 64  49237 2023-08-21 00:26:00 8.28 53.4     7966  66.39
## 65  49237 2023-08-21 01:44:00 8.23 53.3     7924   1.69
## 66  49237 2023-08-21 01:46:00 8.18 53.3     7424  61.87
## 67  49237 2023-08-21 01:48:00 8.14 53.2     6464  53.87
## 68  49237 2023-08-21 01:50:00 8.11 53.2     5435  45.30
## 69  49237 2023-08-21 01:52:00 8.08 53.1     4566  38.05
## 70  49237 2023-08-21 01:54:00 8.06 53.1     4083  34.02
## 71  49237 2023-08-21 01:56:00 8.04 53.1     3805  31.71
## 72  50893 2023-10-26 18:38:00 8.78 54.3       NA     NA
## 73  50893 2023-10-26 18:40:00 8.78 54.3     4512  37.60
## 74  50893 2023-10-26 18:42:00 8.78 54.2     6349  52.91
## 75  50893 2023-10-26 18:44:00 8.79 54.2     7782  64.85
## 76  50893 2023-10-26 18:46:00 8.80 54.2     4161  34.67
## 77  50893 2023-10-26 18:48:00 8.81 54.2     3563  29.69
## 78  50893 2023-10-26 18:50:00 8.82 54.2     3549  29.58
## 79  50893 2023-10-26 18:52:00 8.84 54.2     3582  29.85
## 80  50893 2023-10-26 18:54:00 8.86 54.2     3786  31.55
## 81  50893 2023-10-26 18:56:00 8.87 54.1     4128  34.40
## 82  50893 2023-10-26 18:58:00 8.88 54.1     4686  39.05
## 83  50893 2023-10-26 19:00:00 8.88 54.1     4778  39.82
## 84  50893 2023-10-26 19:02:00 8.88 54.0     4666  38.88
## 85  50893 2023-10-26 19:04:00 8.86 54.0     4434  36.95
## 86  50893 2023-10-26 19:06:00 8.82 54.0     4008  33.40
## 87  50893 2023-10-26 19:08:00 8.77 54.0     4874  40.62
## 88  50893 2023-10-26 19:10:00 8.67 54.0     7373  61.44
## 89  50893 2023-10-26 19:12:00 8.53 53.9    12532 104.44
## 90  50893 2023-10-26 19:50:00 8.37 53.8    15571   6.83
## 91  50893 2023-10-26 19:52:00 8.24 53.7    13940 116.16
## 92  50893 2023-10-26 19:54:00 8.19 53.7     7902  65.85
## 93  50893 2023-10-26 19:56:00 8.15 53.6     5129  42.74
## 94  50893 2023-10-26 19:58:00 8.10 53.6     4446  37.05
## 95  50893 2023-10-26 20:00:00 8.07 53.6     3563  29.69
## 96  50893 2023-10-26 20:02:00 8.05 53.6     3443  28.69
## 97  50893 2023-10-26 20:04:00 8.05 53.6     3243  27.03
## 98  50893 2023-10-26 20:06:00 8.06 53.6     3279  27.33
## 99  50893 2023-10-26 20:08:00 8.07 53.6     3555  29.62
## 100 50893 2023-10-26 20:10:00 8.07 53.6     3384  28.20
## 101 50893 2023-10-26 20:12:00 8.00 53.7     6202  51.69
## 102 50893 2023-10-26 20:14:00 7.80 53.7    13819 115.16
## 103 50893 2023-10-26 20:16:00 7.75 53.7     5640  47.00
## 104 50893 2023-10-26 20:18:00 7.73 53.7     3564  29.70
## 105 50893 2023-10-26 20:20:00 7.65 53.7     6875  57.29
## 106 50893 2023-10-26 20:34:00 7.44 53.7    14031  16.70
## 107 50893 2023-10-26 20:36:00 7.26 53.7    12533 104.44
## 108 50893 2023-10-26 20:38:00 7.22 53.7     4187  34.89
## 109 50893 2023-10-26 20:40:00 7.22 53.7     3086  25.72
## 110 50893 2023-10-26 20:42:00 7.23 53.7     3014  25.12
## 111 50893 2023-10-26 20:44:00 7.23 53.7     2993  24.94
## 112 50893 2023-10-26 20:46:00 7.22 53.7     3094  25.78
## 113 50893 2023-10-26 20:48:00 7.20 53.6     3333  27.77
## 114 50893 2023-10-26 20:50:00 7.19 53.6     3276  27.30
## 115 50893 2023-10-26 20:52:00 7.16 53.6     3744  31.20
## 116 50893 2023-10-26 20:54:00 7.14 53.6     3947  32.89
## 117 50893 2023-10-26 20:56:00 7.13 53.6     4484  37.37
## 118 50893 2023-10-26 21:04:00 7.09 53.6     5591  11.65
## 119 50893 2023-10-26 21:06:00 7.08 53.5     4463  37.19
## 120 50893 2023-10-26 21:08:00 7.08 53.5     3502  29.19
## 121 50893 2023-10-26 21:10:00 7.08 53.5     3193  26.61
## 122 50893 2023-10-26 21:12:00 7.08 53.5     3124  26.03
## 123 50893 2023-10-26 21:14:00 7.08 53.5     3047  25.39
## 124 50893 2023-10-26 21:20:00 7.08 53.5     3634  10.09
## 125 50893 2023-10-26 21:22:00 7.09 53.5     3403  28.36
## 126 50893 2023-10-26 21:24:00 7.09 53.5     3505  29.21
## 127 50893 2023-10-26 21:26:00 7.08 53.5     5099  42.49
## 128 50893 2023-10-26 21:28:00 6.93 53.4    13121 109.34
## 129 50893 2023-10-26 21:30:00 6.51 53.3    30901 257.50
## 130 50893 2023-10-26 23:26:00 5.92 53.2    41977   6.03
## 131 50893 2023-10-26 23:28:00 5.35 53.1    40417 336.81
## 132 50893 2023-10-26 23:30:00 4.99 53.0    26002 216.68
## 133 50893 2023-10-26 23:38:00 4.84 52.9    12071  25.15
## 134 50893 2023-10-26 23:40:00 4.82 52.9     4532  37.77
## 135 50893 2023-10-26 23:42:00 4.83 52.9     3690  30.75
## 136 50893 2023-10-26 23:44:00 4.82 52.9     3397  28.31
## 137 50893 2023-10-26 23:46:00 4.81 52.9     3565  29.71
## 138 50893 2023-10-26 23:48:00 4.78 52.9     3955  32.96
## 139 50893 2023-10-26 23:50:00 4.76 52.9     3705  30.88
## 140 50893 2023-10-26 23:52:00 4.75 52.9     3658  30.49
## 141 50893 2023-10-26 23:54:00 4.74 52.9     3705  30.87
## 142 50893 2023-10-26 23:56:00 4.71 52.9     3827  31.89
## 143 50893 2023-10-26 23:58:00 4.68 52.8     3736  31.13
## 144 50893 2023-10-27 00:00:00 4.67 52.8     3572  29.77
## 145 50893 2023-10-27 00:02:00 4.67 52.8     3548  29.57
## 146 50893 2023-10-27 00:04:00 4.67 52.8     3565  29.71
## 147 50893 2023-10-27 00:06:00 4.64 52.8     4090  34.08
## 148 50893 2023-10-27 00:08:00 4.62 52.8     4106  34.22
## 149 50893 2023-10-27 00:10:00 4.61 52.8     3730  31.08
## 150 50893 2023-10-27 00:12:00 4.59 52.8     3623  30.19
## 151 50893 2023-10-27 00:14:00 4.59 52.8     3675  30.62
## 152 50893 2023-10-27 00:16:00 4.57 52.7     5006  41.72
## 153 50893 2023-10-27 00:18:00 4.55 52.7     8544  71.20
## 154 50893 2023-10-27 00:46:00 4.53 52.6     7474   4.45
## 155 50893 2023-10-27 00:48:00 4.53 52.6     5539  46.16
## 156 50893 2023-10-27 00:50:00 4.52 52.6     3938  32.82
## 157 50893 2023-10-27 00:52:00 4.52 52.6     3553  29.61
## 158 50893 2023-10-27 00:54:00 4.52 52.6     3610  30.08
## 159 50893 2023-10-27 00:56:00 4.53 52.6     3535  29.46
## 160 50893 2023-10-27 00:58:00 4.53 52.6     3642  30.35
## 161 50893 2023-10-27 01:00:00 4.53 52.6     4498  37.48
Plot flight speed
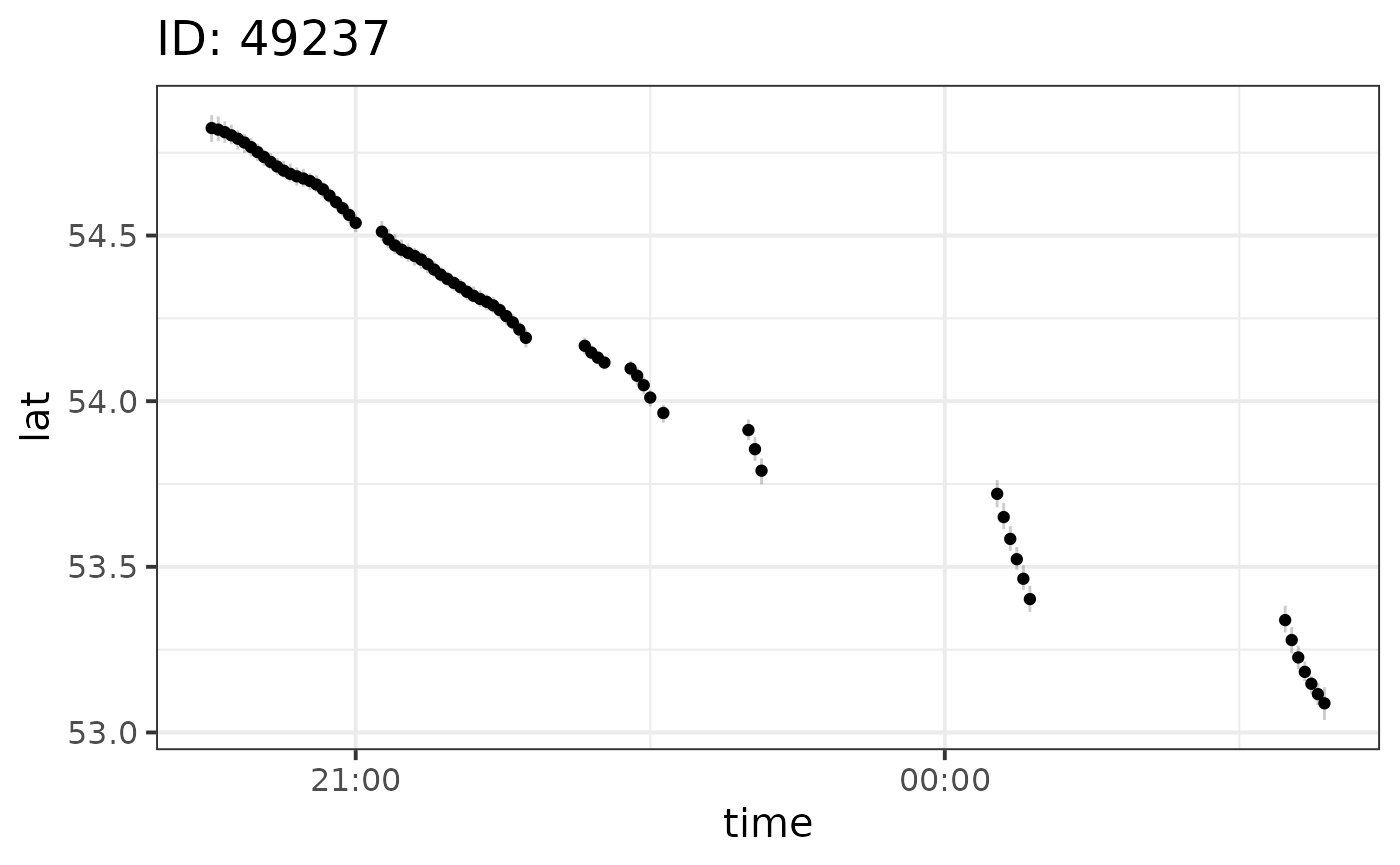
We can plot the results per individual and output variable using the
plot function:
plot(fit, id = 49237)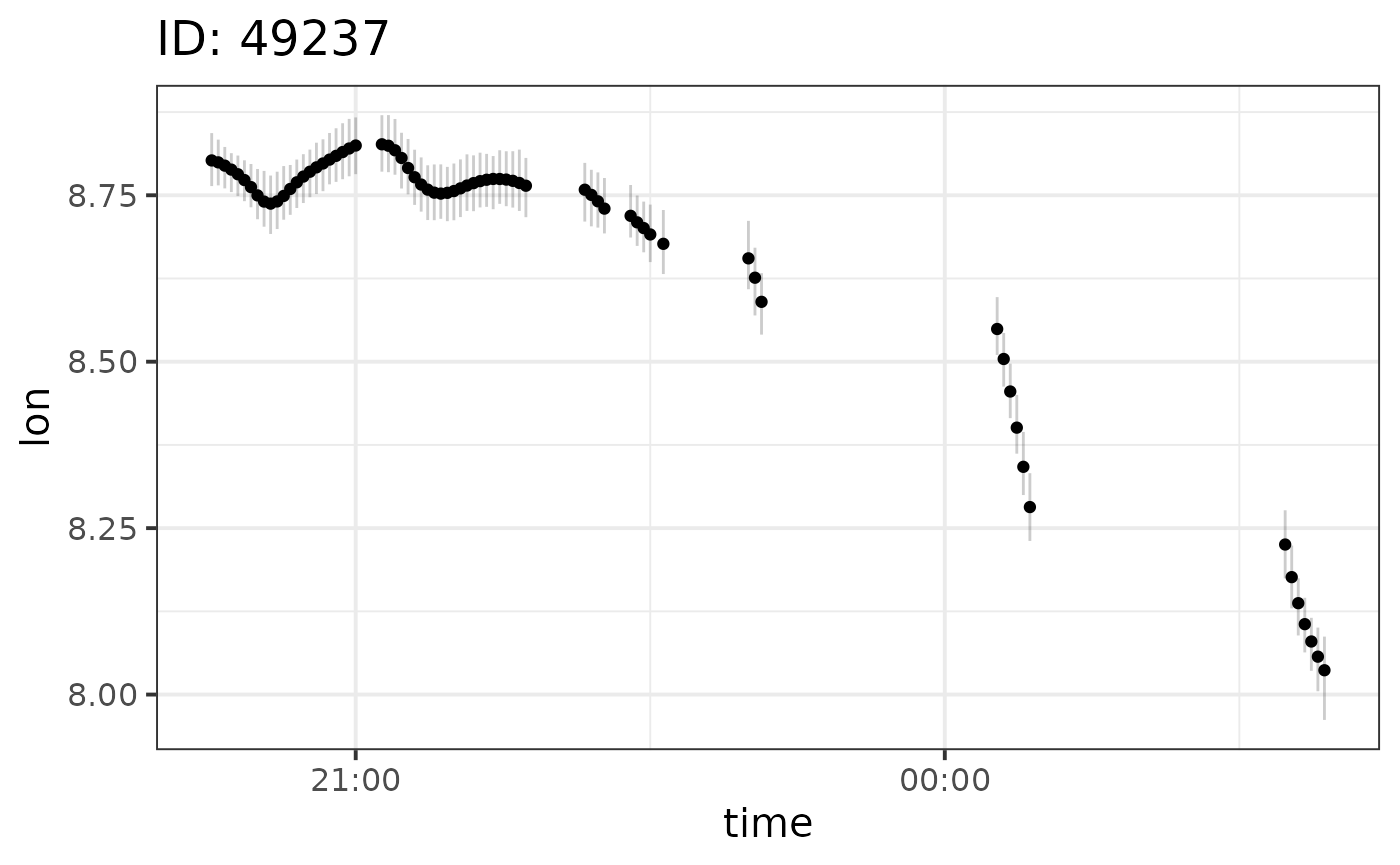
Plot flight paths
We can visualise the results on a map using the mapTrack
function:
mapTrack(fit) +
    geom_point(aes(recvDeployLon, recvDeployLat), data = motusData)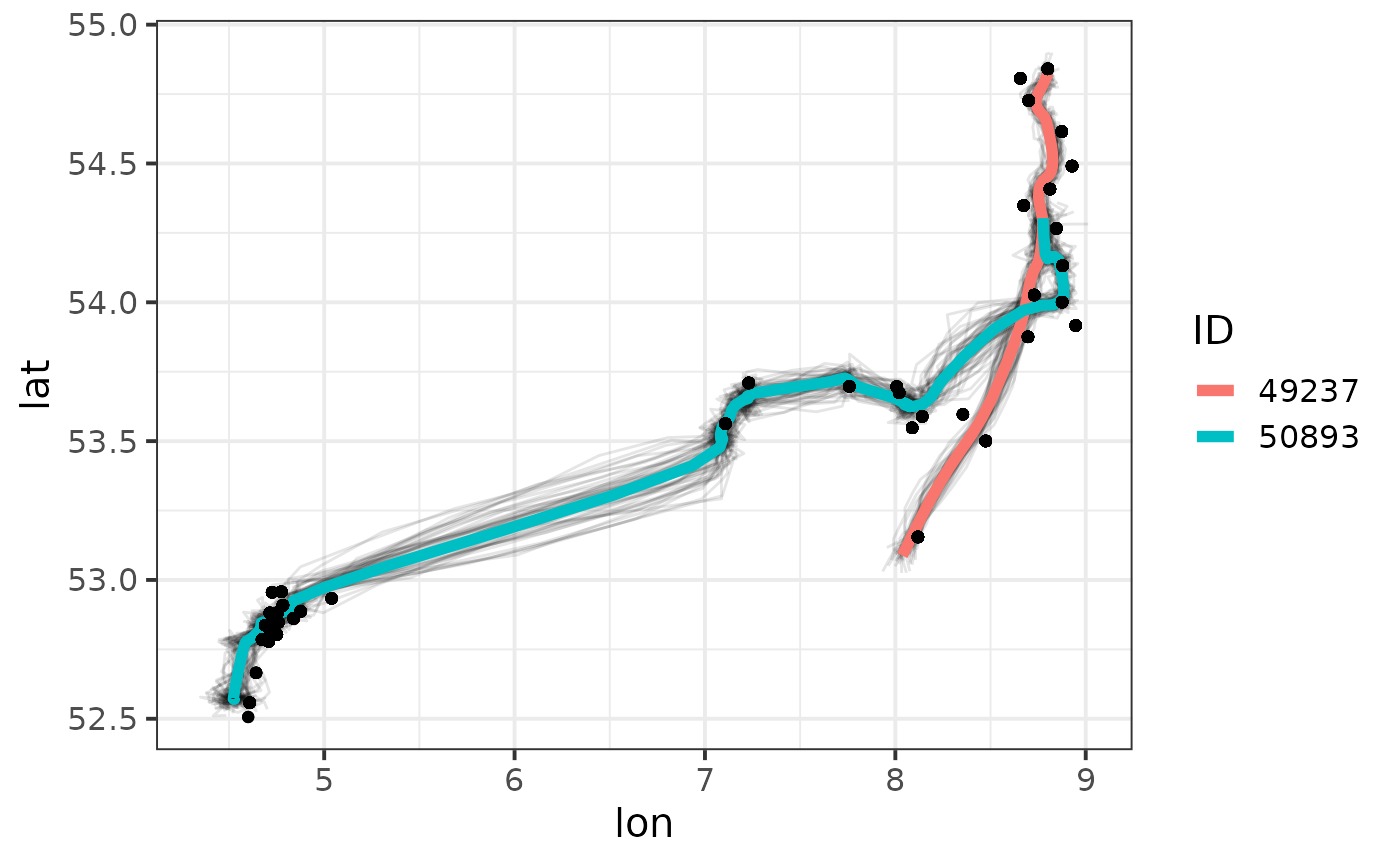
Modelled movement trajectories per individual. Posterior means are shown together with 50 posterior draws, circles on the map indicate receiver locations with detections of the animals.
We could also create a Leaflet map using the following code:
library(sfheaders)
library(leaflet)

# Extract draws
draws <- getDraws(fit) |>
    sf_linestring("lon", "lat", linestring_id = "tID")

# Leaflet map
fit |>
    as.data.frame() |>
    sf_linestring("lon", "lat", linestring_id = "ID") |>
    leaflet() |>
    addTiles() |>
    addPolylines(data = draws, color = "grey", weight = 1, opacity = 0.2) |>
    addPolylines(color = ~ c("orange", "blue"))